
Exploring Predictive Indicators of Diabetes in Women patients
Project Goal
Analyze a dataset from the National Institute of Diabetes and Digestive and Kidney Diseases and explore how how certain diagnostic factors affect the diabetes outcome of women patients.
Process
-
Data Exploration in Python (EDA)
Checked for missing or zero values in critical features (like insulin and skin thickness).
Plotted distributions and correlations for features like BMI, glucose, and age.
Analyzed relationships between features and the Outcome variable (diabetes diagnosis: 0 = No, 1 = Yes).
-
Visualization in Tableau
Created a dashboard to surface the most insightful relationships:
BMI vs. Diabetes Outcome: higher BMI is strongly associated with positive diagnoses
Blood Pressure, Glucose, Insulin by Age: used bubble scatter plots to explore variation across lifespan
Diabetes Pedigree Function by Age: older age + higher pedigree function often linked to diagnoses
Boxplot of BMI by Diagnosis: clearly shows higher median BMI in diagnosed individuals
Part 1 -
Data Exploration in Python
Data Inspection and Cleaning
import pandas as pd
import numpy as np

df = pd.read_csv('diabetes.csv')
df.info()
df.describe()
df.head()

cols_with_zero_issues = ['Glucose', 'BloodPressure', 'SkinThickness', 'Insulin', 'BMI']
(df[cols_with_zero_issues] == 0).sum()

df_cleaned = df.copy()
df_cleaned[cols_with_zero_issues] = df_cleaned[cols_with_zero_issues].replace(0, np.nan)
df_cleaned.dropna(inplace=True)

Distribution by Outcome
import seaborn as sns
import matplotlib.pyplot as plt
for col in ['Glucose', 'BMI', 'Age', 'DiabetesPedigreeFunction']:
plt.figure(figsize=(6, 4))
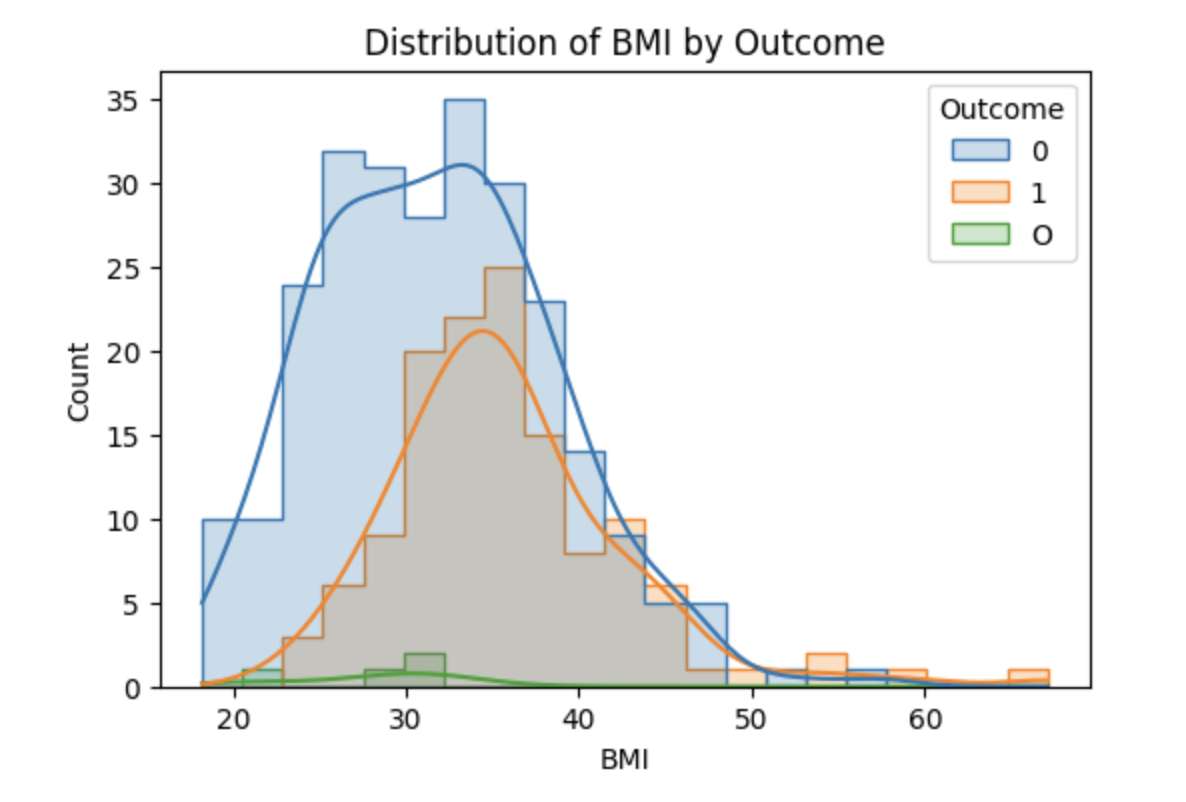
sns.histplot(data=df_cleaned, x=col, hue='Outcome', kde=True, element="step")
plt.title(f'Distribution of {col} by Outcome')
plt.show()
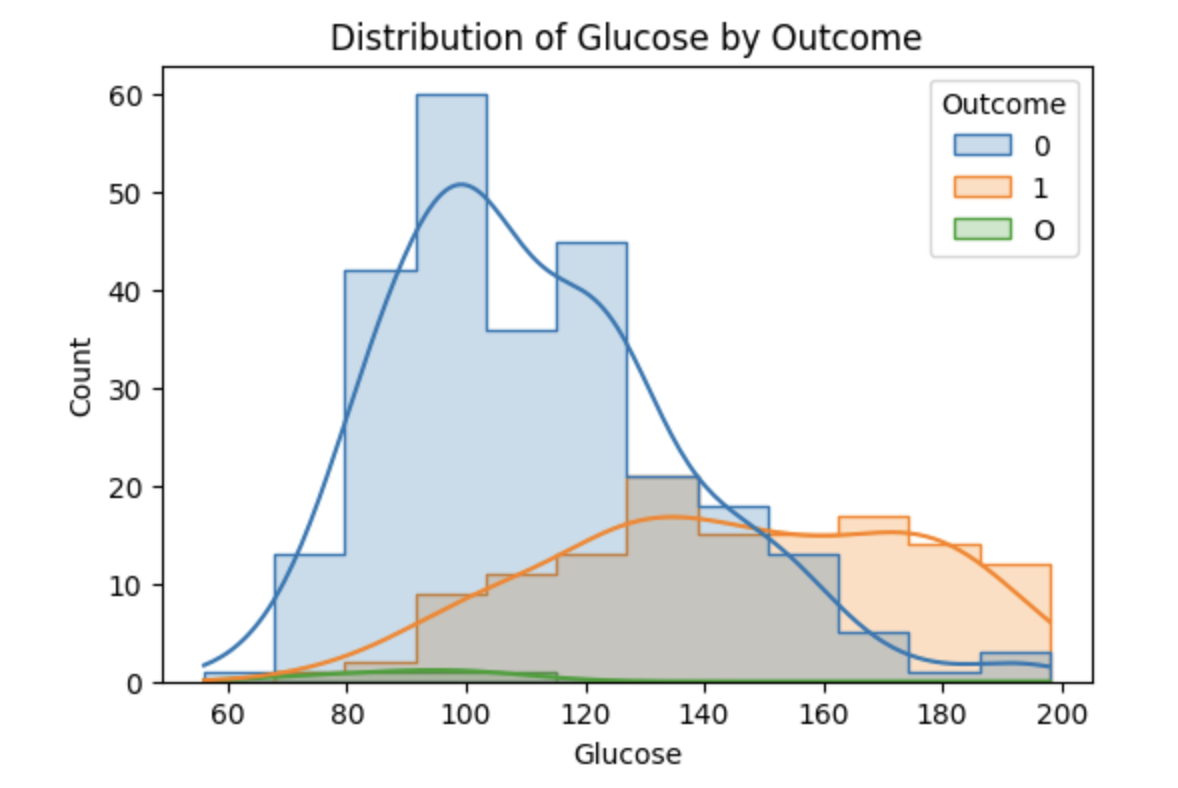


Glucose levels were significantly higher in diagnosed individuals, with a clear shift rightward in the distribution.
BMI also showed a noticeable right-skew among diagnosed patients, though less pronounced than glucose.
Diabetes Pedigree Function showed wider spread in diagnosed patients, with several outliers above 1.0, suggesting stronger family history linkage.
Age distribution showed that non-diagnosed participants skew younger, while diagnosed participants were more uniformly distributed across age brackets.
Distribution by Outcome
numeric_df = df_cleaned.select_dtypes(include='number')

plt.figure(figsize=(10, 8))
sns.heatmap(numeric_df.corr(), annot=True, cmap="coolwarm", fmt=".2f")
plt.title("Feature Correlation Matrix")
plt.show()
Glucose had the strongest positive correlation with diabetes diagnosis.
BMI and DiabetesPedigreeFunction followed as moderately correlated.
Pregnancies showed moderate correlation overall and was more predictive when paired with higher age groups.

Part 2 -
Visualization in Tableau
Blood Pressure, Glucose, Insulin, Skin Thickness Measures by Age
Glucose increases more visibly with age in diagnosed patients
Insulin values show extreme variance and inconsistency (possible data quality issue)

Diabetes Diagnosis vs BMI
Clear visual split: median BMI is higher in diagnosed patients
Diagnosed group contains more outliers with BMI > 40

Diabetes Pedigree Function by Age
Age 50–70 tends to have higher pedigree scores among diagnosed individuals
Pedigree function peaks in the 50–60 age group → suggests increased genetic risk in older patients

Summary
Glucose, BMI, and pedigree score are the top indicators for diabetes in this group.
There’s a need for better handling of missing biometric values like insulin.
Age trends show the impact of family history and metabolic changes over time.
Ideas from data visualization
Early screening tools using just glucose, BMI, and family history
Data cleanup methods or clinician training to reduce gaps in insulin/skin thickness tracking
Predictive modeling apps for providers to assess diabetes risk without relying on all 9 variables